DDPlot#
- class skfda.exploratory.visualization.DDPlot(fdata, dist1, dist2, chart=None, *, depth_method, fig=None, axes=None, c=None, cmap_bold=None, x_label='X depth', y_label='Y depth')[source]#
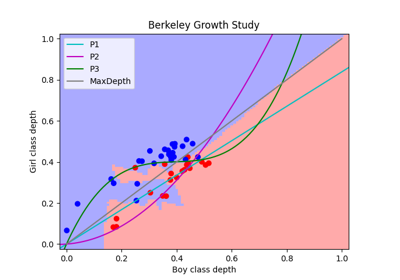
DDPlot visualization.
Plot the depth of our fdata elements in two different distributions, one in each axis. It is useful to understand how our data is more related with one subset of data / distribution than another one. :param fdata: functional data set that we want to examine. :param dist1: functional data set that represents the first distribution that
we want to use to compute the depth (Depth X).
- Parameters:
dist2 (T) – functional data set that represents the second distribution that we want to use to compute the depth (Depth Y).
depth_method (Depth[T]) – method that will be used to compute the depths of the data with respect to the distributions.
chart (Figure | Axes | None) – figure over with the graphs are plotted or axis over where the graphs are plotted. If None and ax is also None, the figure is initialized.
fig (Figure | None) – figure over with the graphs are plotted in case ax is not specified. If None and ax is also None, the figure is initialized.
axes (Axes | None) – axis where the graphs are plotted. If None, see param fig.
fdata (T)
dist1 (T)
c (NDArrayInt | None)
cmap_bold (ListedColormap)
x_label (str)
y_label (str)
- Attributes:
depth_dist1 – result of the calculation of the depth_method into our first distribution (dist1).
depth_dist2 – result of the calculation of the depth_method into our second distribution (dist2).
Methods
- hover(event)[source]#
Activate the annotation when hovering a point.
Callback method that activates the annotation when hovering a specific point in a graph. The annotation is a description of the point containing its coordinates.
- Parameters:
event (MouseEvent) – event object containing the artist of the point hovered.
- Return type:
None